
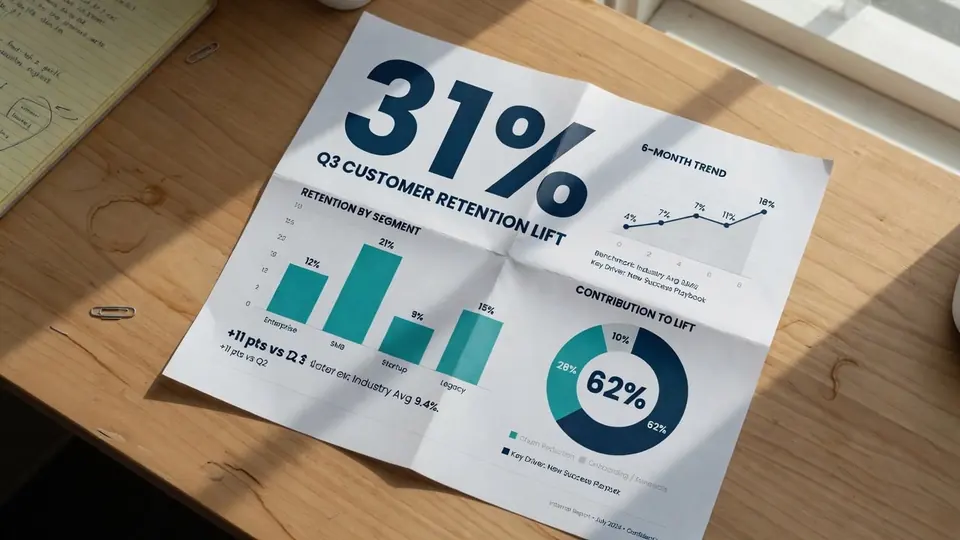
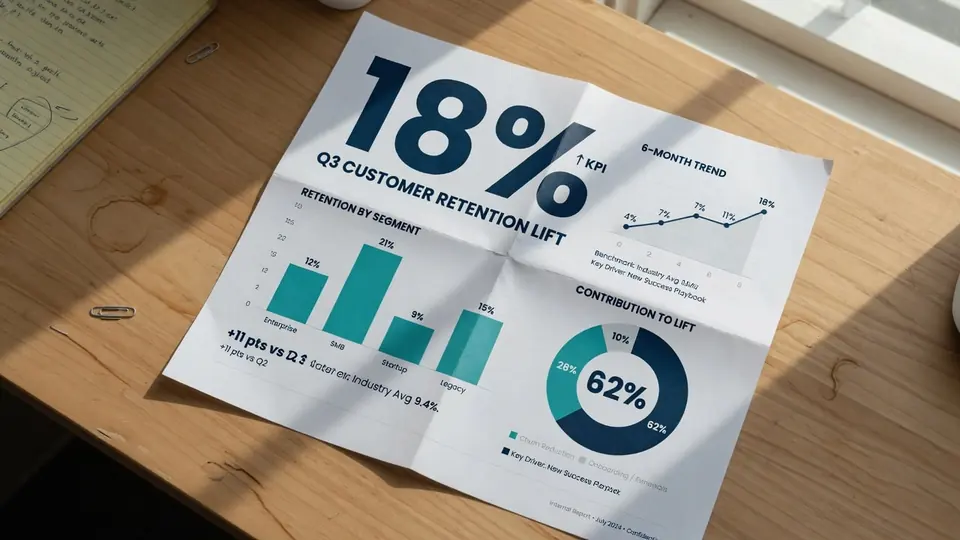

Infographic Chart Stats & Legend Revision
Revise growth rate metrics and legend text directly on flat infographic PNG/JPGs (e.g. 42% GROWTH ➔ 68% EXPANSION) while preserving typography weight and crisp background.
Revise data points, chart legends, timelines, and percentages directly on exported PNG or JPG infographics without Illustrator or Figma. AI matches exact font styles, colors, and clean vector backgrounds.
No image? Try these:
Click to load example1 credits · 1K (30–60s)
Failed generations are automatically refunded.
By clicking Generate, you confirm you own or are licensed to edit this image and that the edit is not intended to deceive a third party — including visa or immigration submissions, fake refund or transaction proofs, and email or chat screenshots altered to falsify sender, content, or timestamp. We do not process IDs, passports, visa support letters, official seals, bank statements, or tampered receipts. Violations result in account termination without refund; request logs are preserved. See Acceptable Use
Trusted by 100,000+ creators & businesses across 180+ countries
Upload your exported PNG, JPG, or WebP infographic, select the stat, legend label, or date text you need to change, and enter your updated data. Our generative inpainting engine removes the outdated text, reconstructs the clean solid or gradient background behind it, and re-renders your new text in the exact matching typography, weight, color, and alignment—no Figma, Illustrator, or source vector layers required.
All samples below are actual AI test results processed by PhotoTextEdit, demonstrating realistic lighting, textures, and typography. Click any preset to load and verify live.


Revise growth rate metrics and legend text directly on flat infographic PNG/JPGs (e.g. 42% GROWTH ➔ 68% EXPANSION) while preserving typography weight and crisp background.
Fast, non-destructive editing in three simple steps.
Upload crisp PNG, JPG, or WebP graphics exported from Canva, Figma, Illustrator, or Slides.
Type the outdated stat, legend label, or date, then enter your updated figures.
AI cleanly inpaints the background and synthesizes matching vector-like typography ready to share.
Common questions about text replacement and accuracy
Yes. You can select any numerical stat (e.g. 45%, .2M, 2024) on an exported infographic image and replace it with your updated metric. The editor repaints the exact font, size, and underlying canvas.
No. This tool is designed specifically for modifying and correcting text on existing, finished infographic images. It changes words, metrics, labels, and dates on exported PNG/JPG/WebP files without requiring source project files.
Our AI analyzes the local context around the text box. Whether your label sits on a solid color block, subtle gradient, or timeline line, the AI seamlessly fills in the background before re-rendering the typography in the matching color scheme.
Yes. Simply select the unwanted text box and leave the new text field blank. The AI will remove the text and intelligently inpaint the underlying vector background or diagram geometry.
High-resolution PNG, JPG, or WebP exported from Canva, Figma, Adobe Illustrator, PowerPoint, or Google Slides work best. Crisp text boundaries yield the most precise font matching and background infill.
Yes. You can replace English chart labels with Spanish, German, French, Chinese, Japanese, or any other language. The editor respects multi-language character sets while preserving the original layout.
You can also use our specialized editors for [Product Packaging](/edit-text-on-packaging), [T-Shirt & Apparel](/edit-text-on-t-shirt), [Screenshots](/screenshot-text-editor), and [Posters](/edit-text-in-poster).
Ready to edit text in your photo? Upload and preview within seconds.
One-time credit packs, priced in USD. No subscription. Credits never expire.
$9.99
30 credits · $0.333 per edit
$19.99
75 credits · $0.267 per edit
$39.99
180 credits · $0.222 per edit
Credits never expire · Failed generations are automatically refunded · Commercial use included
Clear boundaries for revising stats, chart legends, and dates on exported infographics.
Where our AI excels and delivers best-in-class output
Update percentages, dollar figures, or growth metrics directly on exported PNG/JPGs without Illustrator.
Revise category labels, timeline milestones, or axis scales on diagram exports without design files.
Seamlessly inpaints solid card backgrounds, subtle gradient fills, and diagram dividers behind edited text.
Synthesizes exact matching weights and tracking for geometric sans-serif fonts commonly used in modern infographics.
Localize English diagrams into Spanish, German, French, Chinese, or Japanese while preserving clean graphic alignment.
Transparent guidance to save your time
This tool edits text and numbers; it does not redraw pie chart angles or re-plot SVG line graph coordinates.
Strictly prohibited: altering academic research findings, clinical trial metrics, or official census releases.
Charts where labels overlap heavily or text size is smaller than 8px cannot be cleanly separated.
Outputs high-resolution raster images (PNG/WebP/JPG); does not export editable vector paths.